Fit a FPCA Growth Curve Model to measurements of a single individual
Source:R/growthfd.fit.R
growthfd.fit.RdThis function fits a model to the given measured data of a single individual.
Arguments
- model
FPCA growth model to be fitted
- age
Age at measured data points
- height
Height at at measured data points
- nprint
Verbosity
Examples
age <- c(6.9, 8.2, 10, 12.1)
height <- c(114, 122, 130, 141)
fit <- growthfd.fit(model.bgs.m, age=c(6.9, 8.2, 10, 12.1), height=c(114, 122, 130, 141))
#> It.    0, RSS =    485.178, Par. =          0          0          0          0          0          0          0          0          0          0          0          0
#> It.    1, RSS =     3.1692, Par. =  -0.571629  0.0104595   0.168451 -0.0397391 -0.0379149 -0.0407143   -1.23888   0.145635   0.362663  0.0403704  -0.169151  0.0937608
#> It.    2, RSS =    3.09423, Par. =  -0.711257  0.0267281   0.135298 -0.0516135 -0.0241193 -0.0431715    -1.1862  0.0493975   0.302214  0.0346394  -0.110317   0.105836
#> It.    3, RSS =    3.09138, Par. =  -0.745629  0.0269389   0.128213 -0.0550852 -0.0218618 -0.0452404   -1.16704  0.0367215   0.292322  0.0307302 -0.0925947   0.104188
#> It.    4, RSS =    3.09127, Par. =   -0.75232  0.0278816   0.127433 -0.0552554 -0.0222019 -0.0448357   -1.16353  0.0331268    0.29028  0.0293786 -0.0883632    0.10396
#> It.    5, RSS =    3.09126, Par. =   -0.75385  0.0276893   0.127346  -0.055795 -0.0210223 -0.0448326   -1.16264  0.0325376   0.290008  0.0288755 -0.0878558   0.103682
#> It.    6, RSS =    3.09126, Par. =  -0.754202  0.0281535   0.127379 -0.0551045 -0.0202275 -0.0451004   -1.16247  0.0321052   0.289953   0.028924 -0.0872671   0.103875
#> It.    7, RSS =    3.09126, Par. =  -0.754202  0.0281733   0.127399 -0.0551138 -0.0197294 -0.0450847   -1.16247  0.0321439   0.289958  0.0290987 -0.0871899   0.103883
#> It.    8, RSS =    3.09126, Par. =  -0.754202  0.0281742     0.1274 -0.0551128 -0.0197246 -0.0450833   -1.16247  0.0321443   0.289958  0.0291036 -0.0871885   0.103884
x11()
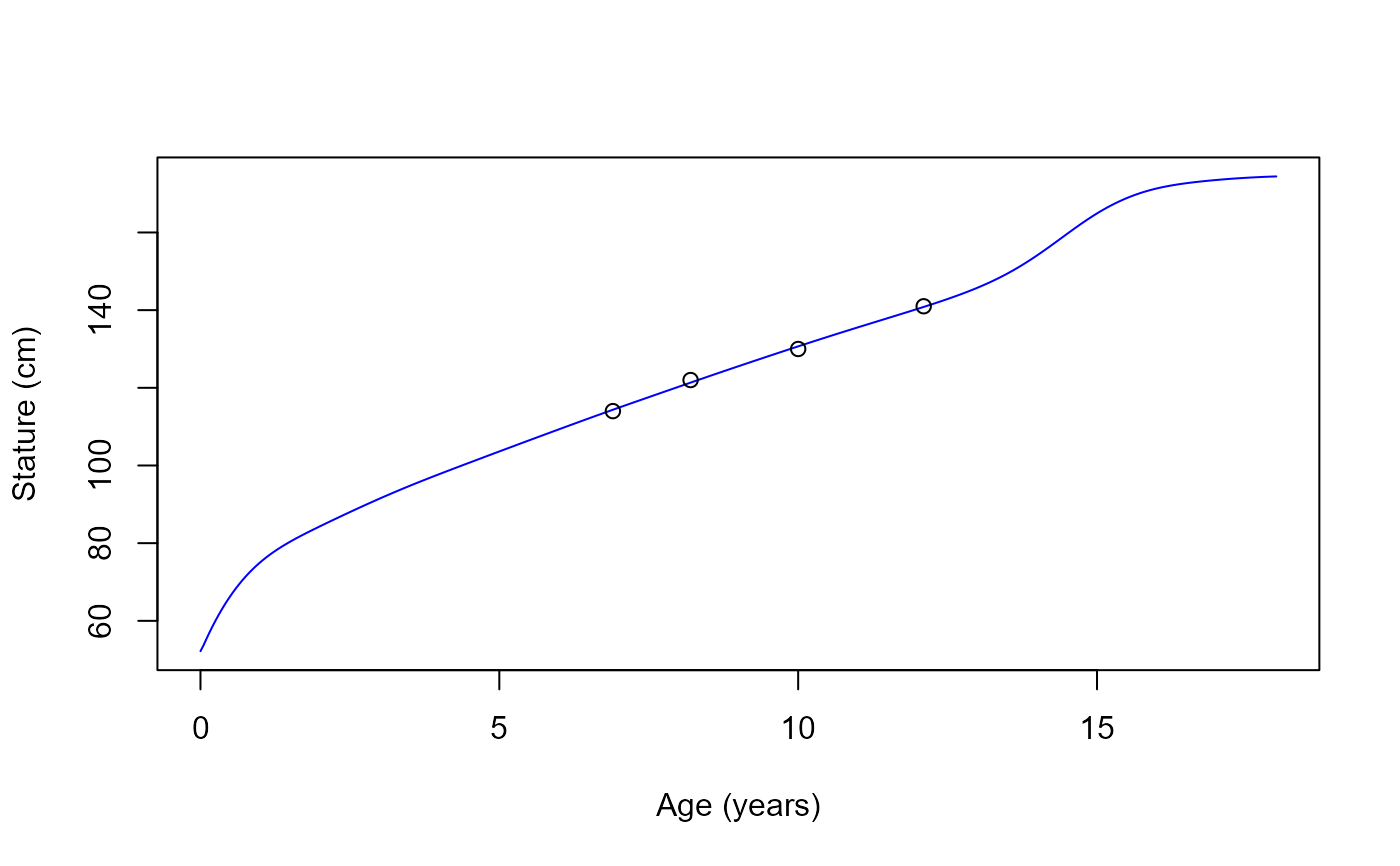
growthfd.plot(model.bgs.m, fit$par)
points(age, height)

x11()
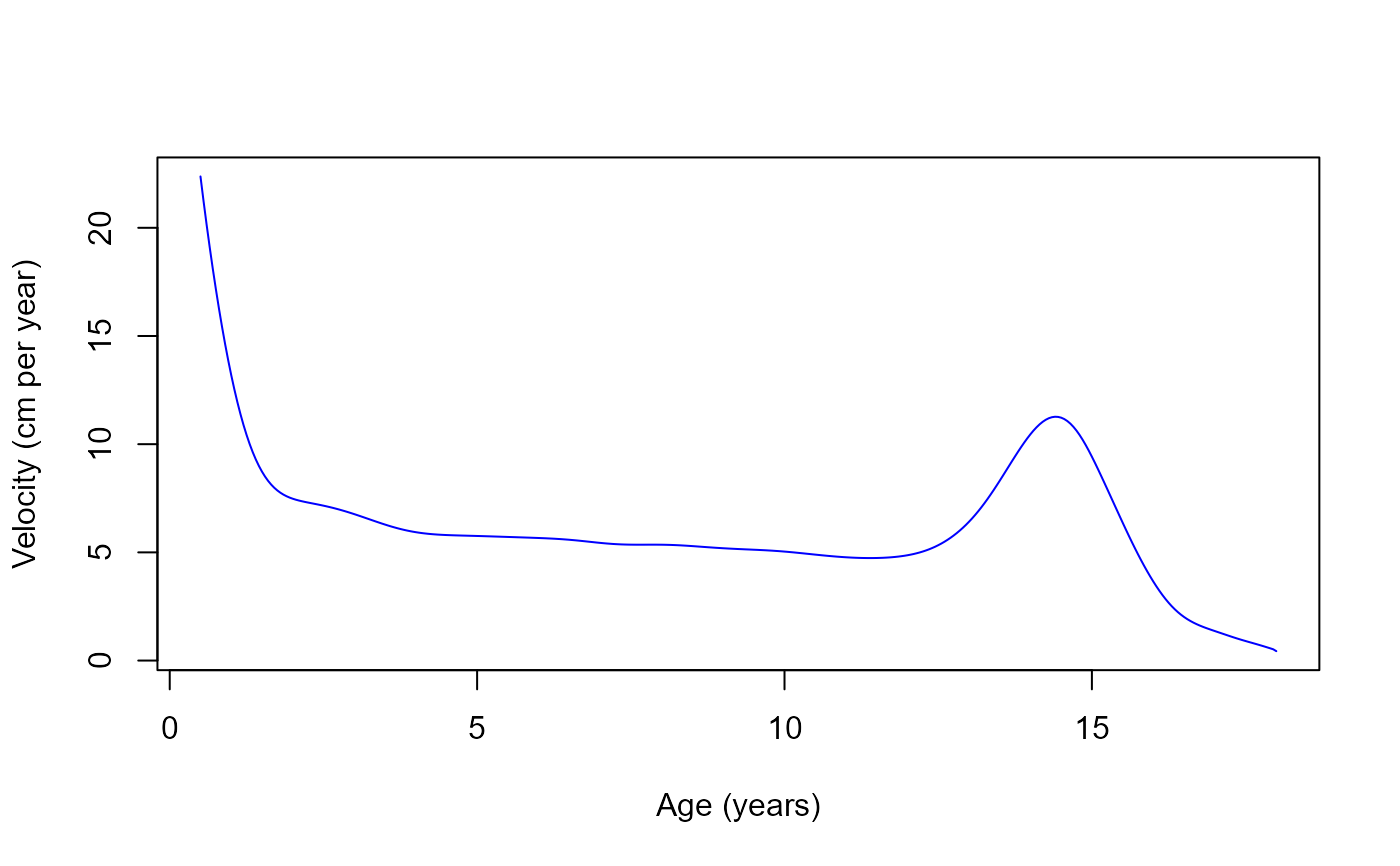
growthfd.plot(model.bgs.m, fit$par, from=0.5, deriv = 1)

x11()
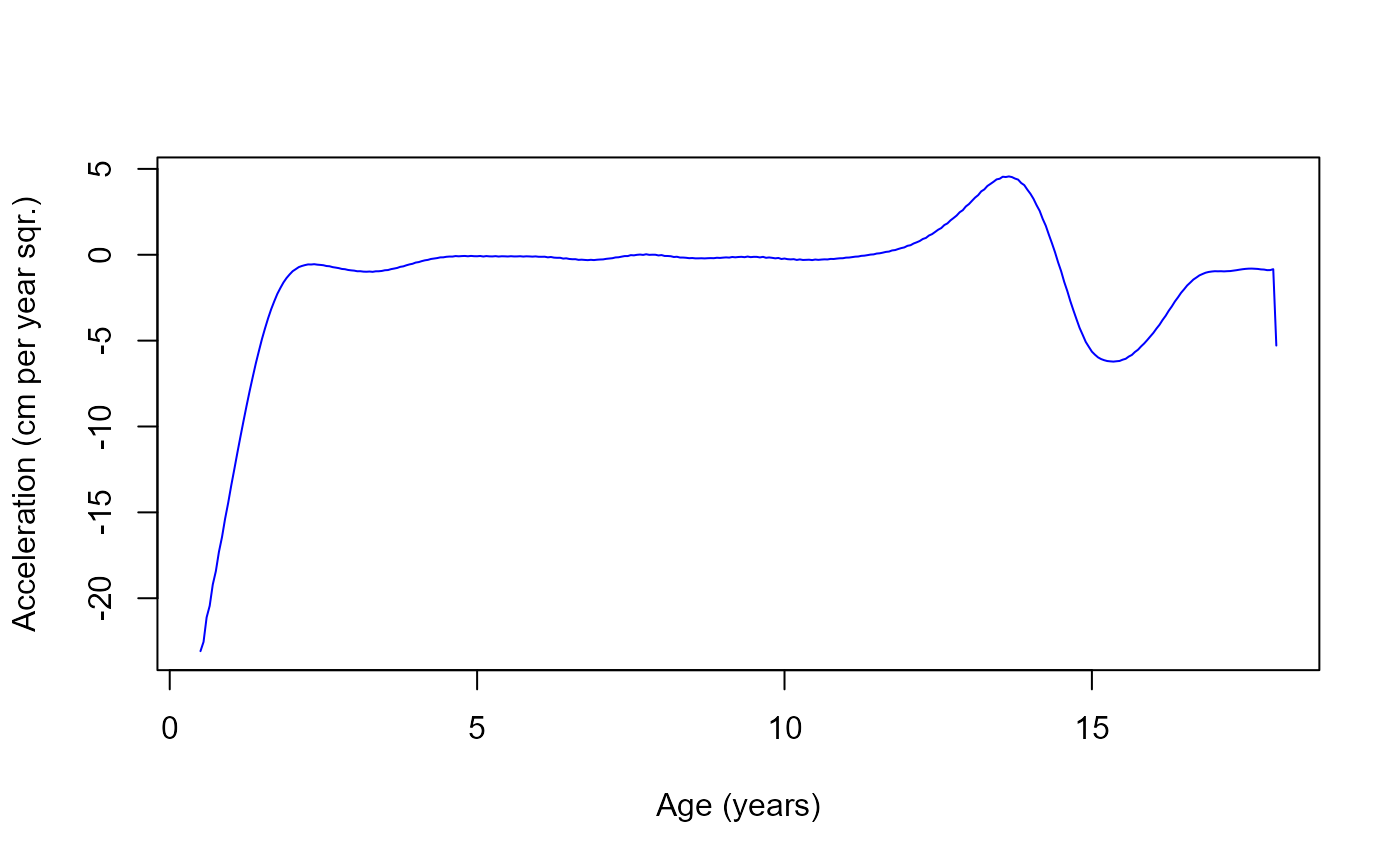
growthfd.plot(model.bgs.m, fit$par, from=0.5, deriv = 2)
