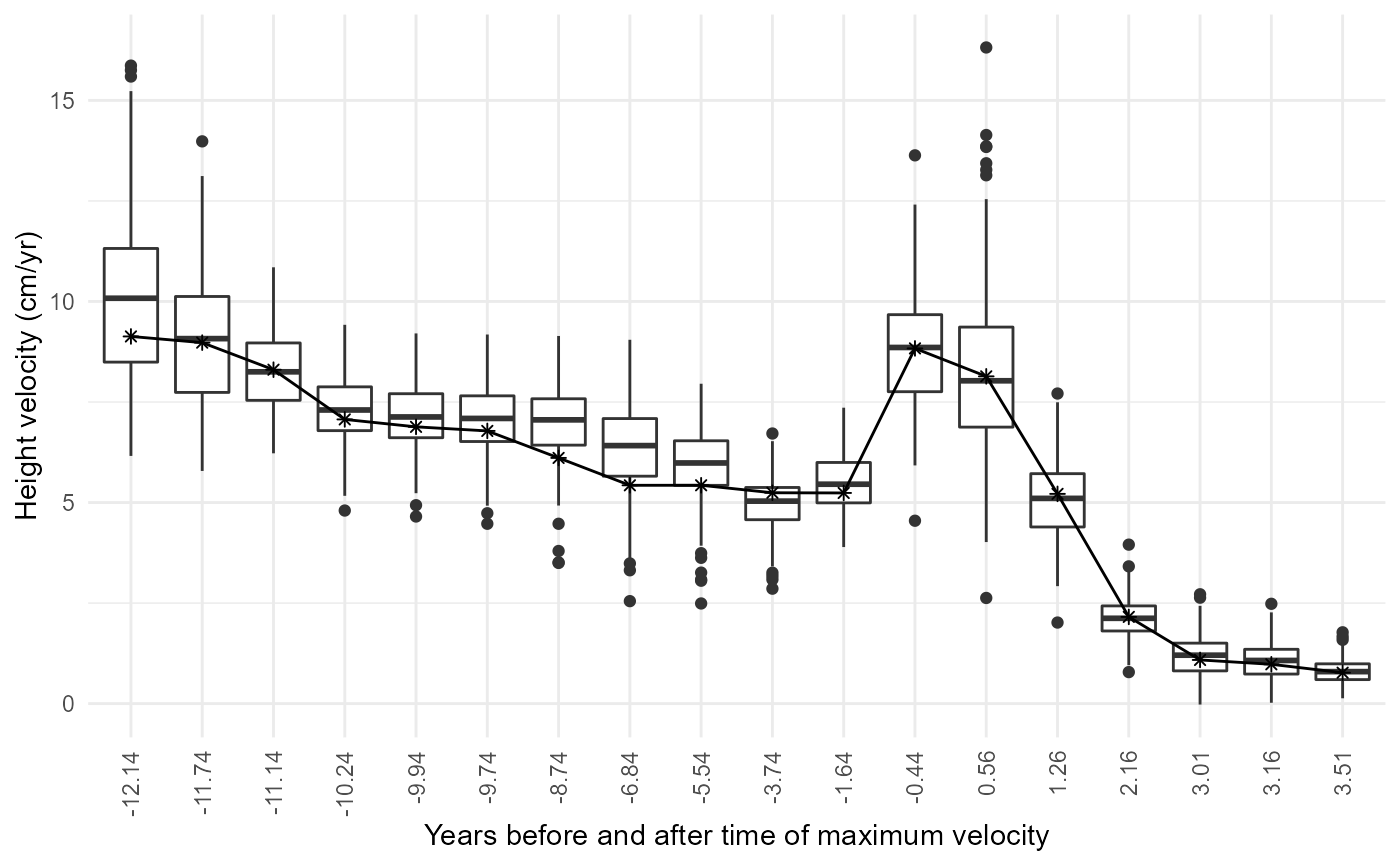
Plot velocity boxplots registered on apv
Source:R/growthfd.plot.RegVelocities.R
growthfd.plot.RegVelocities.RdThis function plots boxplots in time of measurements, after registration of the individual on population apv.
Arguments
- populationData
Data frame for population box plots
- individualData
Data frame for the individual
Examples
filename <- system.file("extdata", "data.csv", package="growthfd", mustWork=TRUE)
csv <- read.csv(filename)
d <- data.frame('id'=as.factor(csv[,'id']), 'x'=csv[,'age'], 'y'=csv[,'height'])
m <- d$id == 'John'
fit <- growthfd.fit(model.bgs.m, age=d$x[m], height=d$y[m])
#> It.    0, RSS =    1622.04, Par. =          0          0          0          0          0          0          0          0          0          0          0          0
#> It.    1, RSS =    18.1131, Par. =   -0.92853   0.590792 -0.0452606   0.629458   -0.52361    0.26631   -1.27108  -0.373017  -0.594539  -0.407316  -0.646637  -0.966524
#> It.    2, RSS =    12.9352, Par. =   -1.23456   0.460783 -0.0701897   0.196413  -0.300864    0.03997    -1.0801  -0.363923  -0.652776  -0.179065  -0.230554  0.0378657
#> It.    3, RSS =    12.8861, Par. =   -1.25334   0.458501   0.020703   0.123401  -0.280285  0.00272613   -1.07024  -0.359267  -0.689483  -0.221977 -0.0976082 -0.00740067
#> It.    4, RSS =    12.8853, Par. =   -1.25988   0.461212  0.0263142   0.113366  -0.275931  0.00162186   -1.06702  -0.363682  -0.696376  -0.216871 -0.0922423 -0.00318999
#> It.    5, RSS =    12.8853, Par. =   -1.25988   0.461215  0.0263632    0.11343  -0.275896  0.00377413   -1.06702  -0.363685  -0.696385  -0.216863 -0.0921115 -0.0028257
#> It.    6, RSS =    12.8853, Par. =   -1.25989   0.461225  0.0264735   0.113505  -0.275862  0.0028931   -1.06702  -0.363692  -0.696408  -0.216869 -0.0918255 -0.00305245
#> It.    7, RSS =    12.8853, Par. =    -1.2599   0.461231  0.0265137   0.113583  -0.275826  0.00184796   -1.06702  -0.363696  -0.696421  -0.216887 -0.0916078 -0.00300673
#> It.    8, RSS =    12.8853, Par. =    -1.2599   0.461233  0.0265305   0.113604  -0.275821  0.00233049   -1.06702  -0.363697  -0.696425   -0.21689 -0.0915695 -0.00281314
#> It.    9, RSS =    12.8853, Par. =    -1.2599   0.461233  0.0265305   0.113604  -0.275821  0.00233049   -1.06702  -0.363697  -0.696425   -0.21689 -0.0915695 -0.00281314
b <- growthfd.RegVelocities(model.bgs.m, fit$par, d$x[m])
#> Warning: the condition has length > 1 and only the first element will be used
#> Warning: the condition has length > 1 and only the first element will be used
#> Warning: the condition has length > 1 and only the first element will be used
#> Warning: the condition has length > 1 and only the first element will be used
#> Warning: the condition has length > 1 and only the first element will be used
#> Warning: the condition has length > 1 and only the first element will be used
#> Warning: the condition has length > 1 and only the first element will be used
#> Warning: the condition has length > 1 and only the first element will be used
p<- growthfd.plot.RegVelocities(b$population, b$individual)
x11()
p
